September 28, 2018 – Samantha Tank, Great Lakes Commission
Updated: May 5, 2022
If you are a PAMF participant, then congratulations! You’ve received data-driven management guidance for the 2018/19 PAMF cycle! We have thrown the term “data-driven” around a lot – but what does that mean? In the past, Phragmites managers have had to use the trial and error approach to control the Phragmites infestation – ‘That didn’t work as well as I had hoped, so let me adjust my efforts.’ Although this approach can improve management strategies, it can also lead to a lot of wasted time and resources.
What is management guidance?
This is where PAMF comes in. With the help of our participants, PAMF tracks Phragmites management actions and outcomes across the Great Lakes basin, documents how well those actions control Phragmites, and communicates those results back out to the managers in the form of management guidance!
Management guidance (see Figure 1) is provided in a combination of three actions (see Management Combination blog) – one for each of the biological phases of Phragmites (translocating, dormant, and growing; see Phragmites’ Annual Cycle blog). PAMF tracks the outcomes of 10 management actions in the form of 16 combinations (See Table 1). In 2020, the PAMF team updated the management guidance options and have provided alternative options with the addition of 1) mid-cycle forecasting guidance and 2) lag-year guidance. However, PAMF’s August guidance remains the best option and is based on the most up-to-date understanding of Phragmites management outcomes at the beginning of the subsequent cycle. For more information on the additional options for guidance see the “More options available for receiving PAMF management guidance” blog.
Limiting the numbers of actions and combinations allows us to speed up the learning and better understand the potential for control that these 16 combinations offer. The guidance that went out to PAMF participants is the combination of actions that the PAMF model predicted would work best at reducing the Phragmites infestation on their particular management unit. Near optimal guidance was also provided for some management units as additional management combinations that the PAMF model predicted would perform within 5% of the optimal management combination.
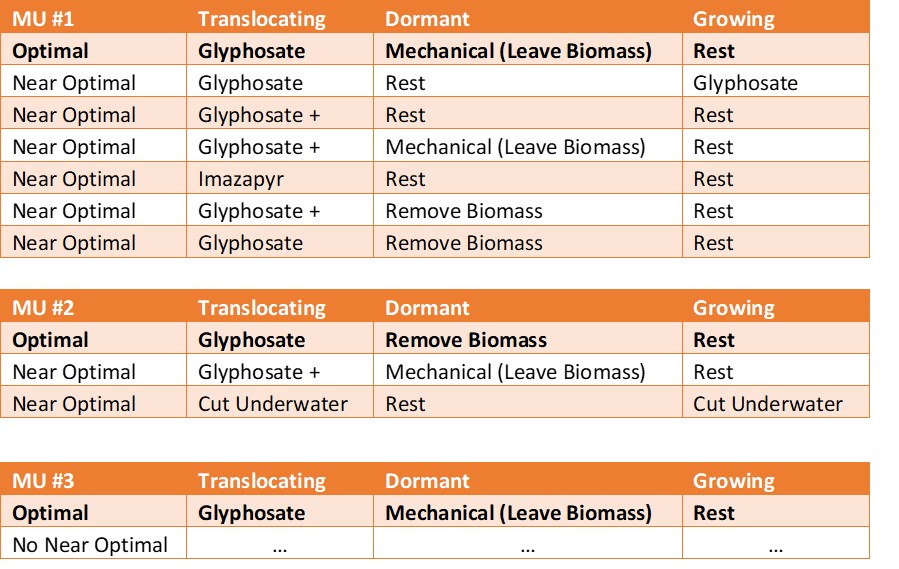
Figure 1. An example of management guidance provided to PAMF participants in mid-August for each of their enrolled management units (MU). The guidance comes as a series of optimal and near optimal management combinations, with the near optimal combinations predicted to perform within 5% of the optimal combination. However, some management units were only provided with an optimal combination of actions when no other combinations were predicted to work nearly as well at reducing the Phragmites infestation.
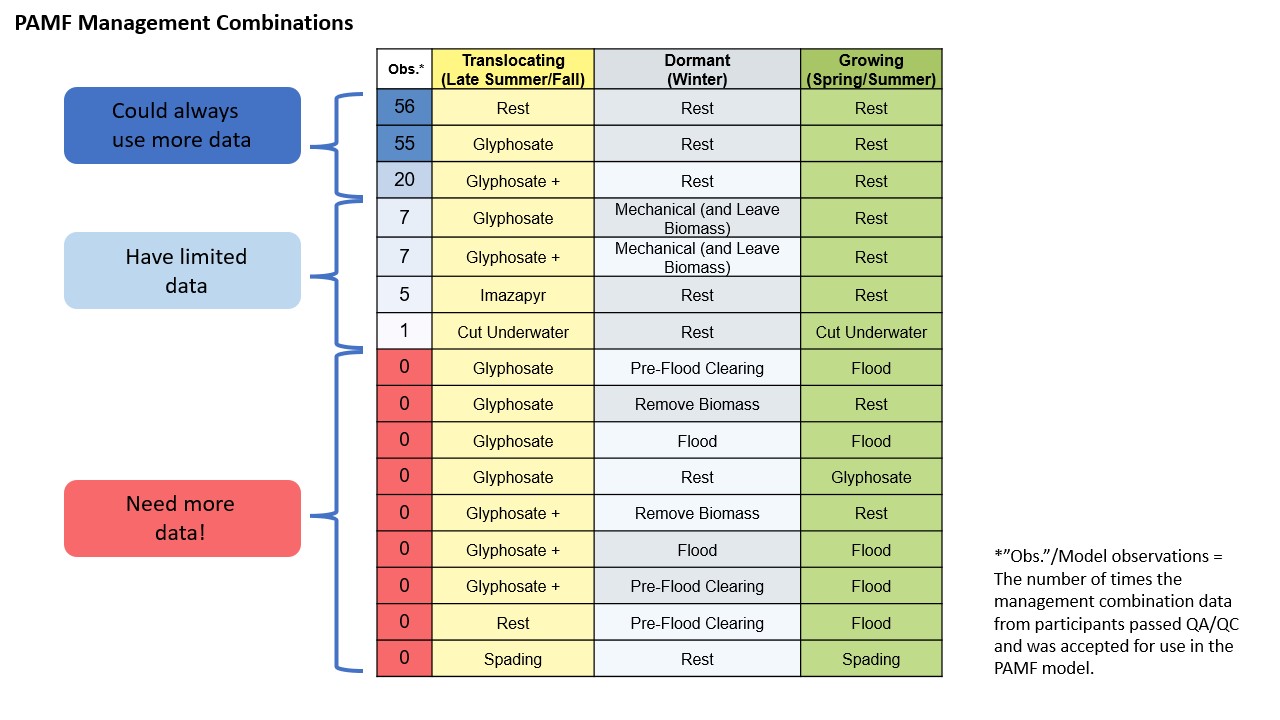
Table 1. PAMF’s management alternatives are a collection of 16 management combinations identified by PAMF. You will receive guidance suggesting the optimal combination. Each combination is made up of separate management actions, one for each phase. The observations we have received for the PAMF model as of 2021, highlighting the continued data needs for different management combinations.
Where does guidance come from?
At this point, you may still be wondering how we come up with “data-driven” guidance in the first place? Let us walk you through it! The data we are referring to are the outcomes of participants’ management actions. The PAMF model (see Figure 2; see Decision Support blog) takes the management reports submitted by participants, then looks at the monitoring reports submitted pre- and post-treatment and determines how well (or not) the implemented management actions worked to reduce the Phragmites infestation on each management unit. The model is then updated with that new information and optimized using the cost data that was also provided by the participants. The cost data allow the model to make recommendations that are not only highly effective but cost efficient as well.
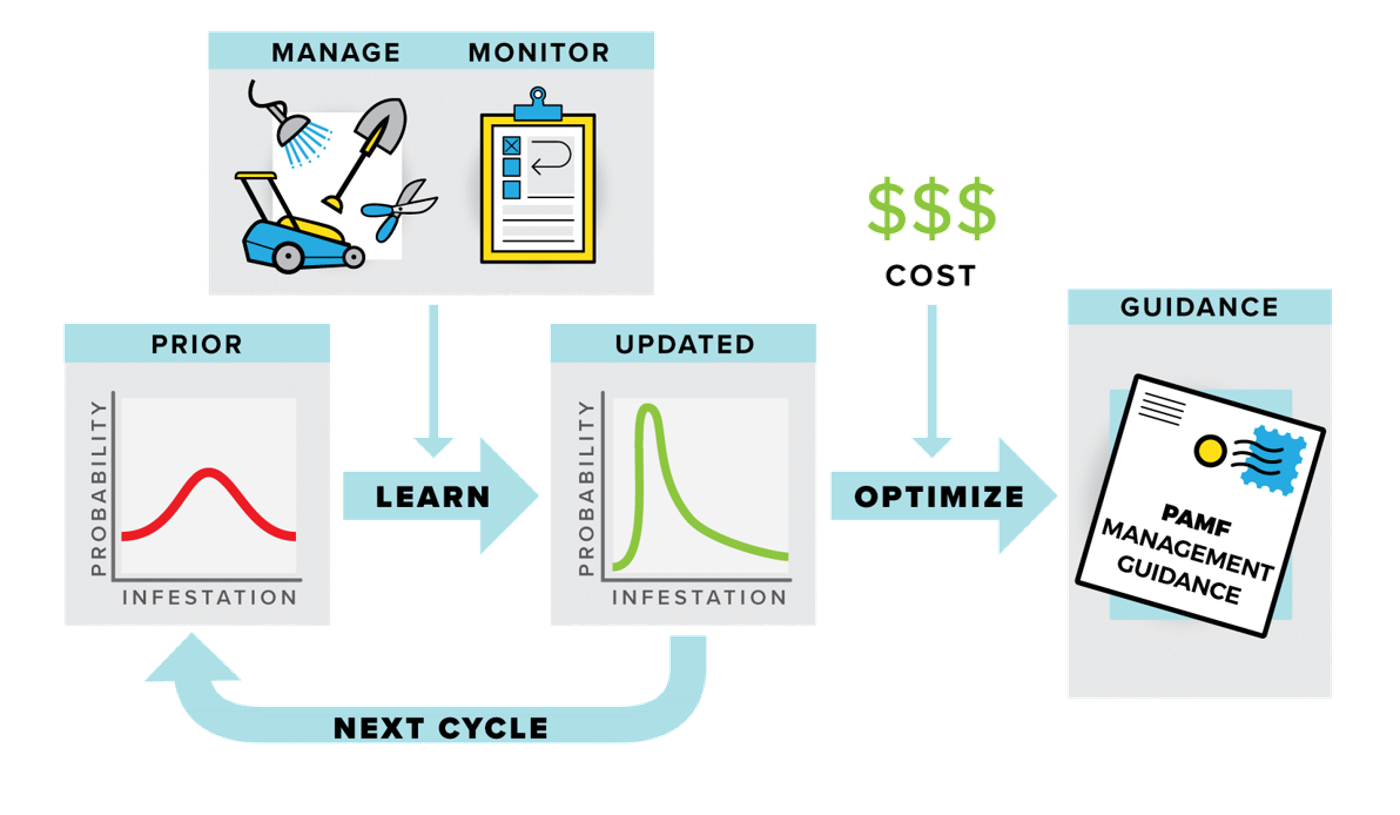
Figure 2. The PAMF model is how we turn the results of your management activities into data-driven guidance! The model is run once per year. The model is shown in the prior and updated boxes, and is annually updated from the data flow as shown by the arrow from the manage and monitor boxes. There are three nested steps to the model: (1) a stack of state-and-transition models (containing possible pre-treatment status of enrolled units and the likelihood/probability of transitioning to another state), (2) annual model updating (of new state-and-transition models from updated likelihood/probabilities based on post-treatment data), and (3) optimization and guidance (management combinations that are most likely to improve the state of a management unit at the lowest cost).
What do I do with the guidance?
Now that you’ve received your guidance, you may be asking yourself, what do I do now? We at PAMF recognize that you are the experts on your own land and how you choose to implement the guidance provided is up to you! However, if you are unsure the best way to implement your recommended management actions, we have resources to help! Check out the Management Actions – Details and Descriptions guide to explore application techniques and considerations for each management action. Additionally, for those using herbicides as part of their annual management strategy, the Calculating Herbicide Concentration Quick Guide is a great resource to check out!
PAMF’s goal is to facilitate collective learning across the Great Lakes basin through a coordinated effort at managing Phragmites infestation. Through this effort, the Great Lakes Phragmites phighting community will reduce the uncertainty of Phragmites management outcomes, stop wasting limited resources, and ultimately get the Phragmites infestation under control in the Great Lakes basin.